Postmortem Sequencing Data
Postmortem Sequencing Data
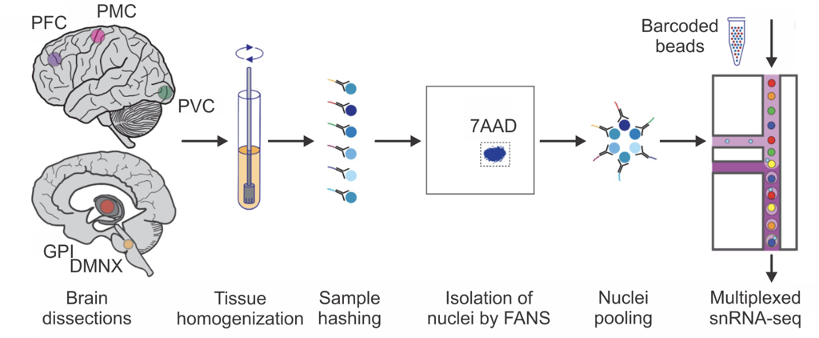
The release 4.2 post-mortem sequencing cohort includes 100 whole-genome sequences (WGS) derived from primary visual cortex and 444 single-nucleus transcriptomes (snRNA-seq) from a total of ~2.1 million brain cells derived from 5 brain regions. The sequenced brain tissue came from 100 individuals in various stages of PD progression as quantified by the Braak scoring system as well as unaffected controls (UC). The five brain regions profiled in single nucleus RNA sequencing were selected to represent early through late stages of Parkinson’s disease; see below: 1) dorsal motor nucleus of the Xth nerve (DMNX); 2) globus pallidus interna (GPI); primary motor cortex (PMC); dorsolateral prefrontal cortex (DLPFC); and 5) the typically unaffected primary visual cortex (PVC). (Fig. 1)
Sample data available in release 4.2 includes primary visual cortex sample WGS data in cram and vcf formats, and snRNA-seq samples from 5 brain regions in separate h5ad files (per individual) as well as a merged h5ad file (all individuals). BigQuery datasets for snRNA-seq and WGS sequence data include AMP PD sample inventory metadata, which can be queried to learn file locations and participant data, and a QC flags data table. AMP PD provides examples of accessing and retrieving clinical, WGS, and RNA sequence data in the postmortem sequencing cohort through workspaces and notebooks in Terra. Registered users can access the workspace below, which includes Jupyter notebooks written in R and in python that can be cloned and edited to suit your needs.
Data Availability
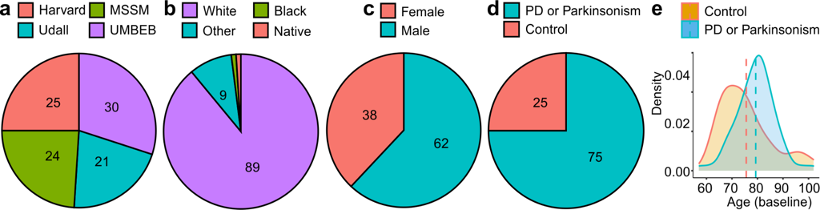
The data available from the release 4.2 postmortem sequencing cohort includes clinical data, whole genome sequencing data and single-nucleus RNA sequencing data from case and control subjects of a range of sexes and ages as depicted below. The samples were taken from post-mortem brains at four brain banks, including Mount Sinai Brain Bank (MS), University of Miami Brain Endowment Bank (UM), Harvard Brain Tissue Resource Center (HA), and Udall Center of Excellence for Parkinson's Disease Research (UD).
| Disease Status | Sex | Age | Data Available | ||||||||
|---|---|---|---|---|---|---|---|---|---|---|---|
| Brain Bank | Samples | Case | Control | Male | Female | under 70 | 70 - 85 | over 85 | Clinical | WGS | snRNAseq |
| Total | 100 | 75 | 25 | 62 | 38 | 16 | 63 | 21 | 100 | 100 | 97 |
| UD | 21 | 21 | 0 | 14 | 7 | 1 | 13 | 7 | 21 | 21 | 21 |
| HA | 25 | 22 | 3 | 15 | 10 | 6 | 15 | 4 | 25 | 25 | 25 |
| UM | 30 | 20 | 10 | 19 | 11 | 6 | 16 | 8 | 30 | 30 | 27 |
| MS | 24 | 12 | 12 | 14 | 10 | 3 | 19 | 2 | 24 | 24 | 24 |
Clinical Data
The following assessments are available for participants in the post-mortem brain study and are harmonized with assessments from other cohorts available in AMP PD. Click an assessment to view additional details such as its definition, values, schema, and curation notes.
| Brain Bank | ||||
|---|---|---|---|---|
| Table Name | UD | HA | UM | MS |
| Demographics | X | X | X | X |
| PD_Medical_History | X | X | X | X |
| Family_History_PD | X | X | ||
| Smoking_and_alcohol_history | X | X | X | |
| Epworth_Sleepiness_Scale | X | |||
| LBD_Cohort_Clinical_Data | X | X | X | X |
| LBD_Cohort_Path_Data | X | X | X | X |
| MDS_UPDRS_Part_I | X | |||
| MDS_UPDRS_Part_III | X | X | ||
| MDS_UPDRS_Part_IV | X | |||
| MMSE | X | X | ||
| Modified_Schwab___England_ADL | X | |||
| UPDRS | X | |||
For studies in which post-mortem samples were collected, such as the Postmortem Sequencing Data cohort, the date of death is used as a substitute for the baseline visit. When premortem clinical data are available for a participant in a postmortem study, visit dates will be negative, indicating the number of months prior to death the event occurred.
WGS
- Data available for individual samples (primary visual cortex samples only)
- CRAM
- gVCF - Genomic variant call format produced by GATK pipeline (suffix g.vcf.gz)
- metric files - Insert size metrics (suffix .insert_size_metrics), Duplication metrics .duplicate_metrics, GC bias metrics (suffix .gc_bias.detail_metrics, .gc_bias.pdf and suffix .gc_bias.summary_metrics), Alignment summary metrics (suffix .alignment_summary), WGS metrics (suffix .wgs_metrics)
RNAseq
- Data available for multiplexed samples
- Multiplexed FASTQ - Raw sequencing data corresponding to up to 6 samples from different individuals.
- Data available for individual samples
- Individual H5AD - Count matrix of gene expression for all cells associated with the given individual (see format definition). No quality control filters were applied.
- Data available for the full sample set
- Merged H5AD: Stage 1 filtering - Count matrix of gene expression for all cells associated with all individuals (see format definition). Only cells with 1,500 - 110,000 UMIs, 1100 - 12,500 gene counts, and mitochondrial content less than 2% were retained. Stage 1 filtering data are included in the v4 release (amppd_merged_snRNAseq.h5ad).
- Merged H5AD: Stage 2 filtering - Building upon Stage 1, this dataset includes additional filtering steps to remove doublets. Doublets were identified and removed using the computational model implemented in Scrublet. Furthermore, during iterative cell type sub-clustering, we excluded clusters that exhibited significant separation from the main population of the same cell type, as these were likely low-quality or doublet cells. These clusters were characterized by an abnormally high number of total counts and/or mixed expression of markers from multiple cell types. Stage 2 filtered dataset is the prioritized version of the matrix and is recommended for most users (amppd_merged_snRNAseq_annotated.h5ad).
Sample Selection Process
The sample selection process aimed to select individuals representing the whole spectrum of PD stages for whom all five brain regions of interest were available. To satisfy this condition, we worked with four brain banks, i.e. Mount Sinai Brain Bank (MSSM), University of Miami Brain Endowment Bank (UMBEB), Harvard Brain Tissue Resource Center (Harvard), and Udall Center of Excellence for Parkinson's Disease Research (Udall). From each brain bank, we aimed to get a similar distribution of sex and age.
Library Prep & Protocol Details (WGS)
DNA was extracted from tissue samples using the QIAmp DNA kit (Qiagen, kit number 51306), according to the manufacturer’s instructions. Once DNA was extracted, samples were quantified using the Qubit Fluorometer (Life Technologies) and PicoGreen (Thermo Fisher), and sample quality was evaluated by checking Fragment Analyzer (Advanced Analytical) traces. WGS libraries were prepared using the Truseq DNA PCR-free Library Preparation Kit (Illumina, kit number 20015965, lot numbers 20698565 and 20706057) in accordance with the manufacturer’s instructions. Briefly, 1ug of DNA was sheared using a Covaris LE220 sonicator (adaptive focused acoustics). DNA fragments underwent bead-based size selection and were subsequently end-repaired, adenylated, and ligated to IDT for Illumina TruSeq DNA UD Indexes (kit 20040870, lot number 20704419). Final libraries were quantified using the Qubit Fluorometer (Life Technologies) or Spectromax M2 (Molecular Devices) and Fragment Analyzer (Advanced Analytical) or Agilent 2100 BioAnalyzer. Libraries were sequenced on an Illumina Novaseq6000 sequencer using 2x150bp cycles and S4 reagent kit v1.5 (catalog number 20028312).
Library Prep & Protocol Details (snRNA-seq)
All buffers were supplemented with RNAse inhibitors (Takara). Six samples were processed in parallel. Twenty-five mg of frozen postmortem human brain tissue from each specimen was homogenized in cold lysis buffer (0.32 M Sucrose, 5 mM CaCl2, 3 mM Magnesium acetate, 0.1 mM, EDTA, 10 mM Tris-HCl, pH8, 1 mM DTT, 0.1% Triton X-100) and filtered through a 40 µm cell strainer. The flow-through was underlaid with sucrose solution (1.8 M Sucrose, 3 mM Magnesium acetate, 1 mM DTT, 10 mM Tris-HCl, pH8) and centrifuged at 107,000 g for 1 hour at 4 °C. Pellets were resuspended in PBS supplemented with 0.5% bovine serum albumin (BSA). Resuspended nuclei were quantified (Countess II, Life Technologies) and 2 million nuclei from each sample were pelleted at 500 g for 5 minutes at 4˚C and re-suspended in 100 µl staining buffer (2% BSA, 0.02% Tween-20 in PBS). Each sample was incubated with 1 µg of a distinct TotalSeq-A nuclear hashing antibody (Biolegend) for 30 min at 4 °C. Prior to Fluorescence-Activated Nuclei Sorting (FANS), volumes were brought up to 250 µl with PBS and 7-AAD (Invitrogen) added to facilitate the detection of nuclei. 7-AAD positive nuclei were sorted into tubes pre-coated with 5% BSA using a FACSAria flow cytometer (BD Biosciences).
Following FANS, nuclei were washed twice in staining buffer before being re-suspended in 22 µl PBS and quantified. Nuclei concentrations were normalized and equal amounts from each sample were pooled together. Two aliquots of 60,000 pooled nuclei (i.e. 10,000 per sample) were processed in parallel using 3’ v3.1 reagents (10x Genomics). At the cDNA amplification step (step 2.2), reactions were supplemented with a hash-tag oligo (HTO) cDNA “additive” primer (GTGACTGGAGTTCAGACGTGTGCTCTTCCGAT*C*T; *Phosphorothioate bond). Following cDNA amplification, supernatants from the 0.6x SPRI selection step were retained for HTO library generation. Otherwise, cDNA libraries were prepared according to the manufacturer’s instructions (10x Genomics). HTO libraries were prepared as described in Stoeckius et al 2018. All libraries were sequenced at NYGC using the Novaseq platform (Illumina).
WGS Data Processing and Quality Control
All 100 samples passed quality control metrics based on the following checks: sample-level contamination (VerifyBamID FREEMIX < 0.03), read coverage (mean coverage ≥ 25), low transition transversion ratio (TiTv ratio < 4 × median absolute deviations from the dbSNP), duplication check (software King), clinically reported sex (software plink).
snRNA-seq Data Processing and Quality Control
Sequencing reads aligned to hg38 via STARsolo. Genotype-based demultiplexing assigned cells to donors using cellSNP-lite, piling up expressed alleles from polymorphic sites with a minimum minor allele frequency of 0.1 and a minimum aggregated Unique Molecular Identifiers (UMI) count of 20. Vireo clustered cells into groups corresponding to six distinct donors per pool, and identity assignment relied on genotype concordance analysis against reference SNP-array data using QTLtools-mbv. While most pools contained cells from expected donors, genotype concordance results detected and corrected occasional sample swaps and mislabeling.
Following genome alignment and demultiplexing, we removed the samples with fewer than 50 cell counts to reduce potential noise in downstream analyses as well as the samples that did not match the expected genotype. This step led to the removal of 46 samples (out of 500 samples). Then, at the cell level, we filtered out low-quality cells based on UMI counts (1,500 ≤ n(UMI) ≤ 110,000), gene counts (1100 ≤ n(genes) ≤ 12,500), and mitochondrial contents (< 2%). Checks for contamination, including ambient RNA and known confounding features, were performed.
In the v4.2 release update (amppd_merged_snRNAseq_annotated.h5ad), cell doublets were identified and removed using the computational model implemented in Scrublet. Additionally, during iterative cell type sub-clustering, we identified and excluded clusters of cells that exhibited extreme separation from the main population of the same cell type, as these were likely to represent low-quality or doublet cells. These clusters were characterized by an abnormally high number of total counts and/or mixed expression of markers from multiple cell types. Finally, at the feature level, genes not robustly expressed by at least 0.05% of cells/nuclei were excluded. After performing these steps, we obtained a cell expression matrix with 2.1 million cells in 444 samples.